American households are now the most heavily invested they have been stocks since 2000.
They are more invested in the stock market when it comes to a percentage of their assets than they were at the 2007 peak.
This is why sentiment surveys show that everyone is bullish and why a dangerous herd has formed in the financial markets.
Look at this chart:
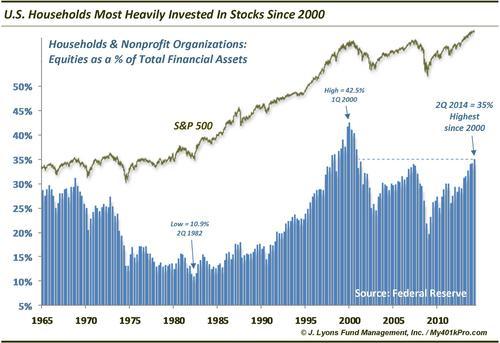
From the Federal Reserve’s latest Z.1 Release (formerly, Flow Of Funds), we learn that in the 2nd quarter, household and nonprofit’s stock holdings rose from 34.2% to 35% of their total financial assets. This is the highest percentage since 2000. In fact, the blow-off phase from 1998 to 2000 leading up to the dotcom bubble burst was the only time in the history of the data (since 1945) that saw higher stock investment than now.
....
After stock investment peaked at 31% in 1968 (by the way, after many of the indexes had topped in 1966 — investors were still buying the dip), it embarked on steady decline over the next 14 years. This, despite the fact the stock market drifted sideways during that time. By the beginning of the secular bull market in 1982, the S&P 500 was right where it was in 1968. However, household stock investment was at an all-time low of 10.9%. If the stock averages drifted sideways, why did stock investment drop by two thirds? The repeated declines over that period left investors scorned and distrustful of the stock market. They never really started putting money back into stocks until 1991.What is the significance of the current reading? As we mentioned, it is the highest reading since 2000. Considering the markets are at an all-time high, this should not be surprising. In fact, while most of the indexes surpassed their prior peaks in early 2013, household stock investment did not surpass the 2007 highs until the first quarter of this year. The financial crisis put a dent in many investors’ psyches (along with their portfolios) and they’ve been slow to return again. However, along with market appreciation, investor flows have seen at least streaks of exuberance over the past 18 months, boosting investment levels.
Yes, there is still room to go (7.5 percentage points) to reach the bubble highs of 2000. However, one flawed behavioral practice we see time and time again is gauging context and probability based on outlier readings.
I find this very worrisome.
No I do not think the stock market is going to crash. I do not think we are in a bear market yet.
Yes we can easily get a pullback over the next few weeks, but if we do I think the market would bounce into the end of the year.
But at some point there will be another bear market and people have convinced themselves that they do not need to worry about that.
TV is telling them that the market will go up forever and most people simply listen and believe what TV tells them to believe.
TV told them things were great in 2007 and it is saying the same thing now. People think they do not need to invest in anything but the US stock market. Some are even selling gold to buy into it when they should be taking advantage of the current pullback in precious metals to invest in gold.
So I worry that when the next bear market comes that it will really hurt people.
The trick though is to carefully monitor the market and the internal action inside it to determine when a bear market is coming. I did this in 2007 and was able to warn people that the bear was there.
I did it in 2000 too.
In fact I made money in both bear markets by betting against the market via short-selling.
And I plan to warn and profit when the next bear comes.
But we are not there yet. But I'm watching and will sound the warning bell for you if we get to that point.
William Fleckenstein did a good interview this week about the psychology going on. To listen to it go here.